
Measure demand
State internet subscriptions, projected population, subscription intensity, IGR and national broadband growth.
Demonstration study • Market & Growth Intelligence • Nigeria broadband
A public-data market intelligence study that moves from national connectivity momentum to state screening, infrastructure feasibility, pricing evidence and a cluster-first entry strategy.
Context
Nigeria’s broadband market was expanding, but national momentum alone could not tell management where fixed-broadband capital should go next.
The study combined state-level demand and commercial-capacity signals with NCC broadband, ISP, FTTX and infrastructure evidence, then added current public provider offers to test whether attractive demand also had a plausible route to entry.
Demonstration note: This is not a client engagement or an investment recommendation. It uses public evidence to demonstrate market-screening, feasibility and decision-framing methods. Address-level coverage, customer density, willingness-to-pay and local build economics still require field validation.
Executive view
Method
The study deliberately avoided a single weighted score. Each gate added evidence and reduced the risk of confusing large internet demand with an investable fixed-broadband opportunity.
State internet subscriptions, projected population, subscription intensity, IGR and national broadband growth.
Quartile- and median-based evidence bands for demand, scale, commercial capacity, headroom and momentum.
Infraco, metropolitan-fibre, ISP/FTTX and provider-footprint evidence to separate promising states from testable clusters.
Public pricing, technology options, unresolved risks and a 90-day micro-market validation sequence.
Findings
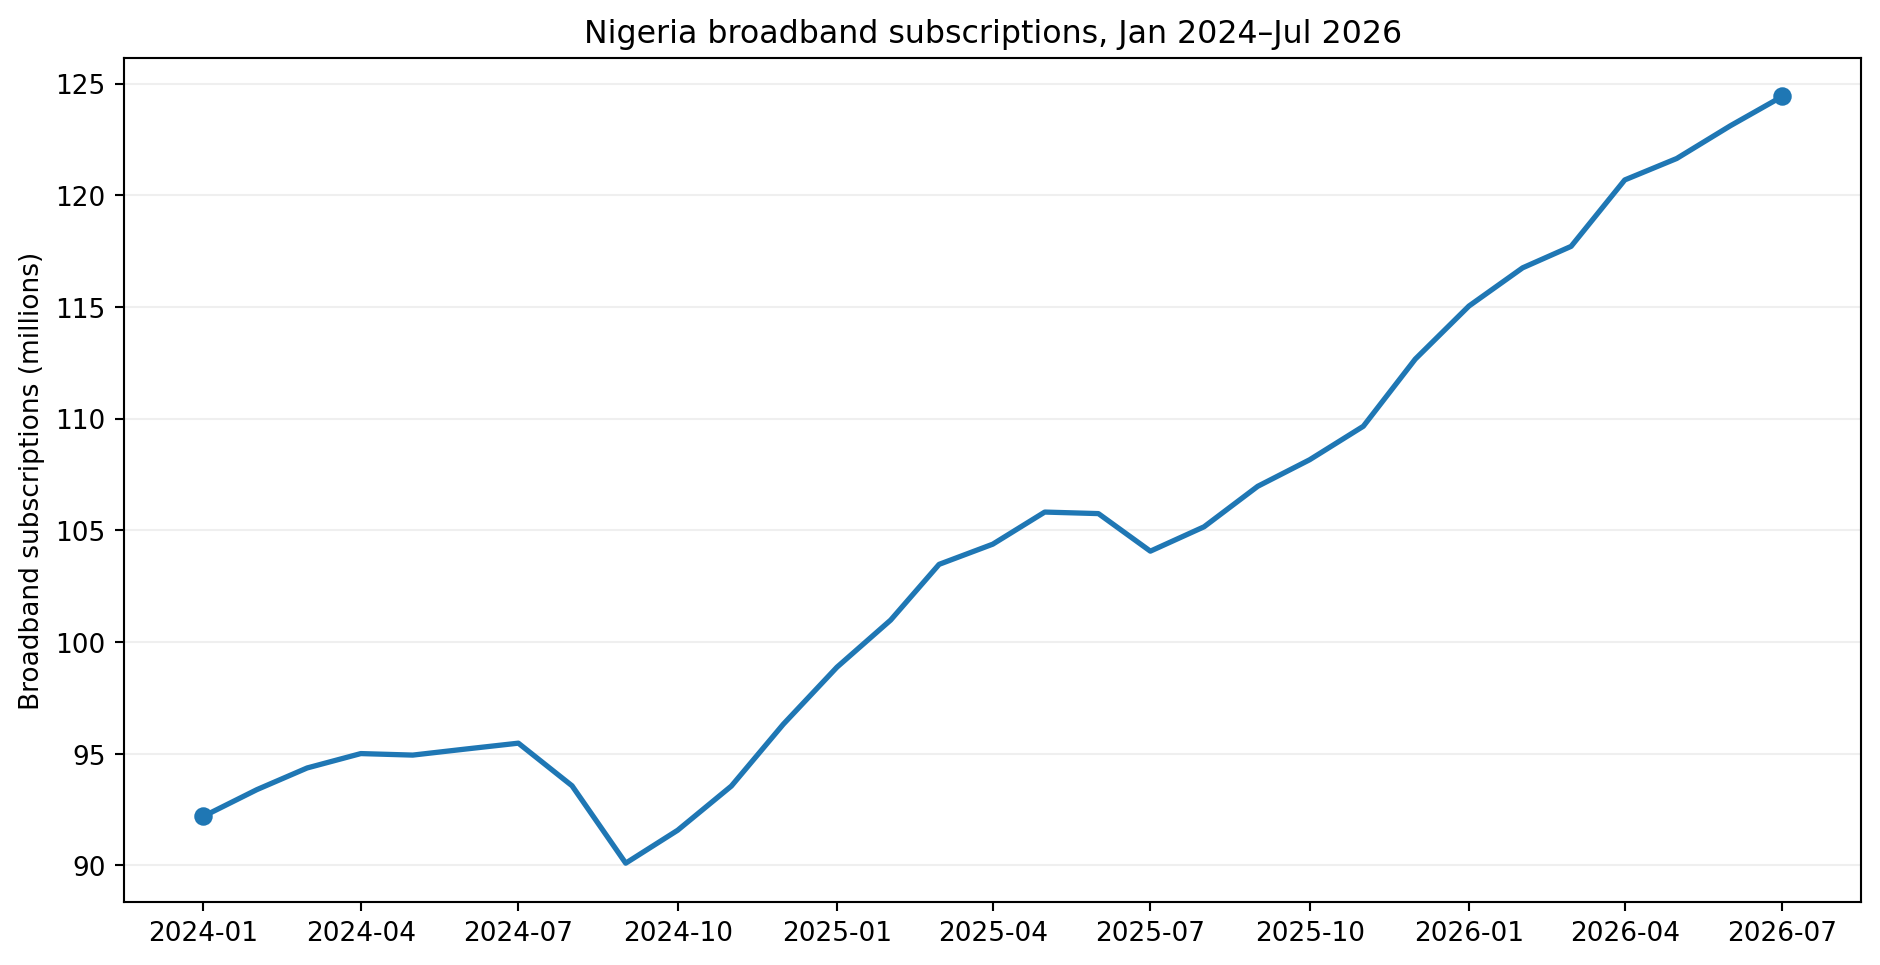
Reported broadband subscriptions rose from about 92.2 million in January 2024 to 124.4 million in July 2026, while penetration increased from 42.5% to 57.4%.
Commercial implication: the national growth story is real, but national momentum cannot determine which fixed-broadband micro-markets deserve capital.
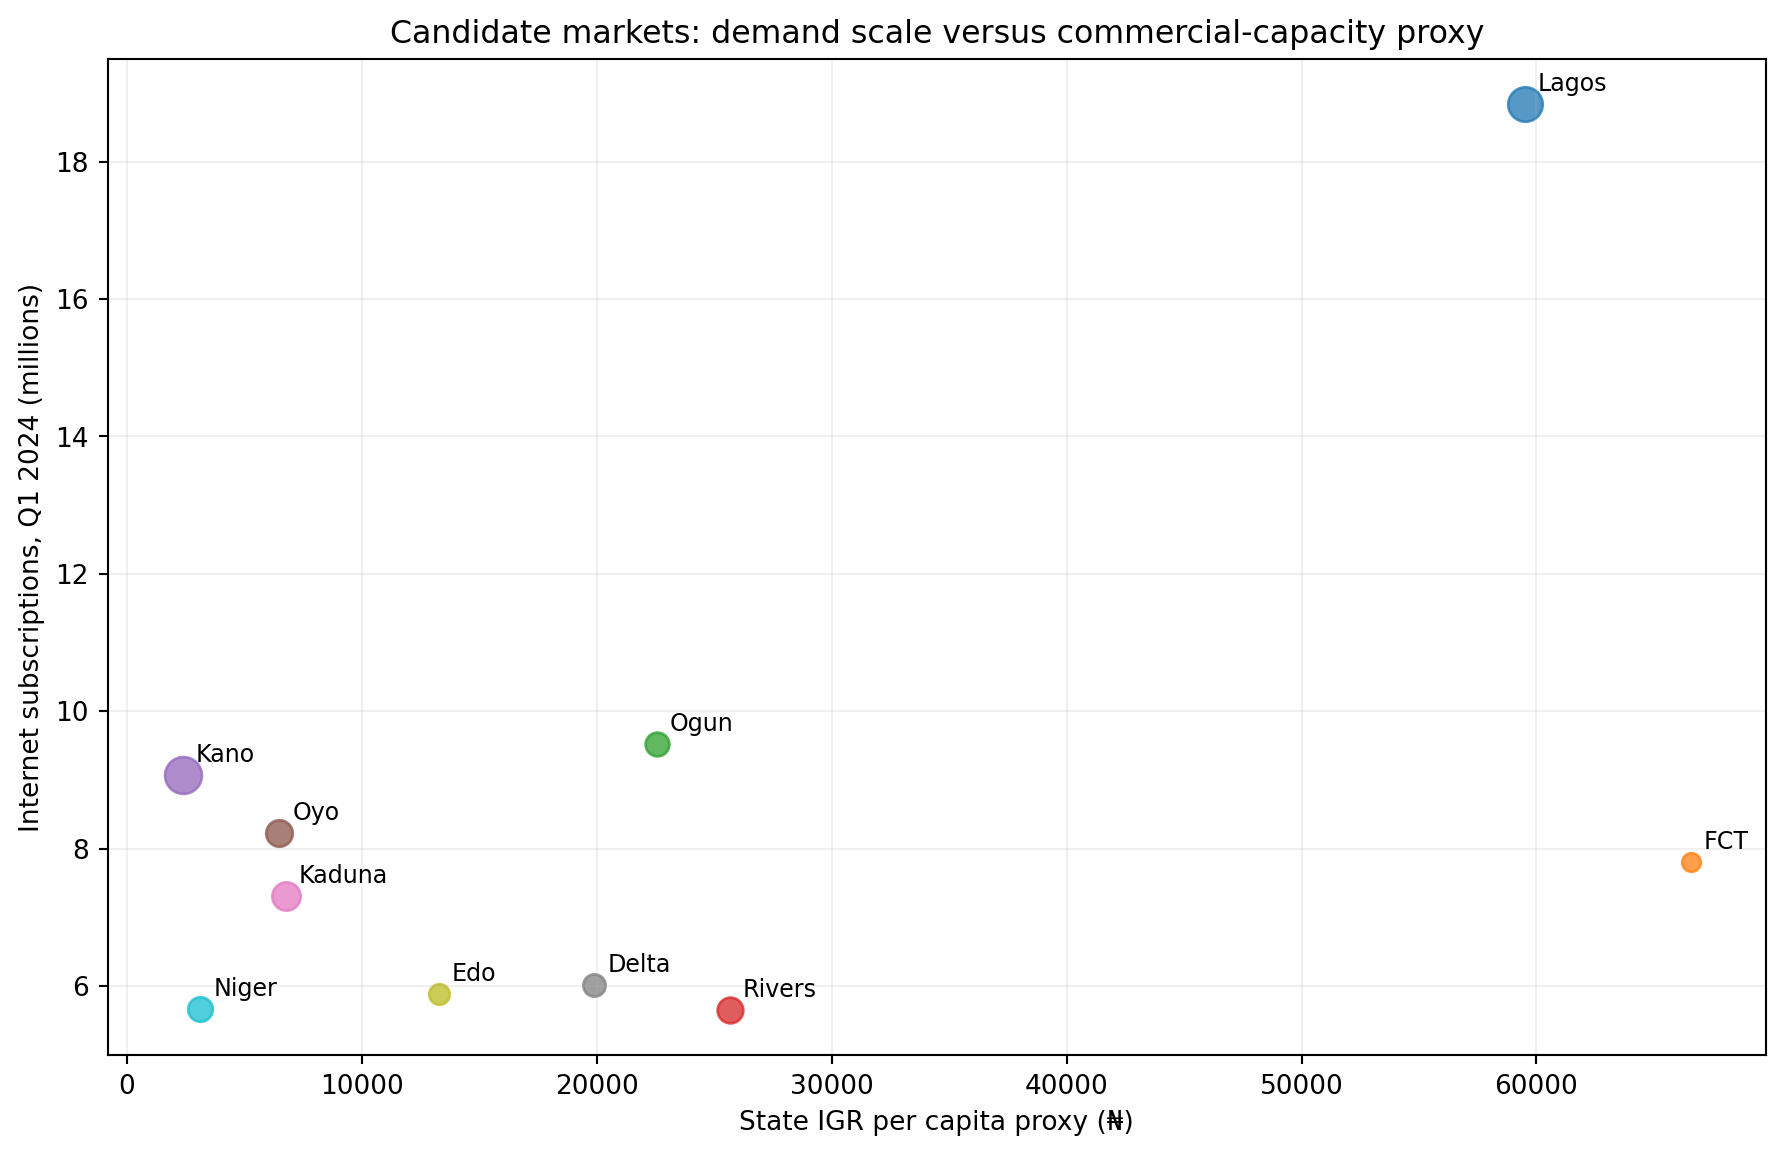
Lagos leads state-attributed internet subscriptions, while Ogun, Kano, Oyo and FCT form a substantial second tier. But the commercial-capacity proxy tells a different story: FCT and Lagos sit far above many large-population markets.
Commercial implication: expansion cannot be based on subscriber scale alone. Demand, monetisation potential, infrastructure and affordability must be tested together.
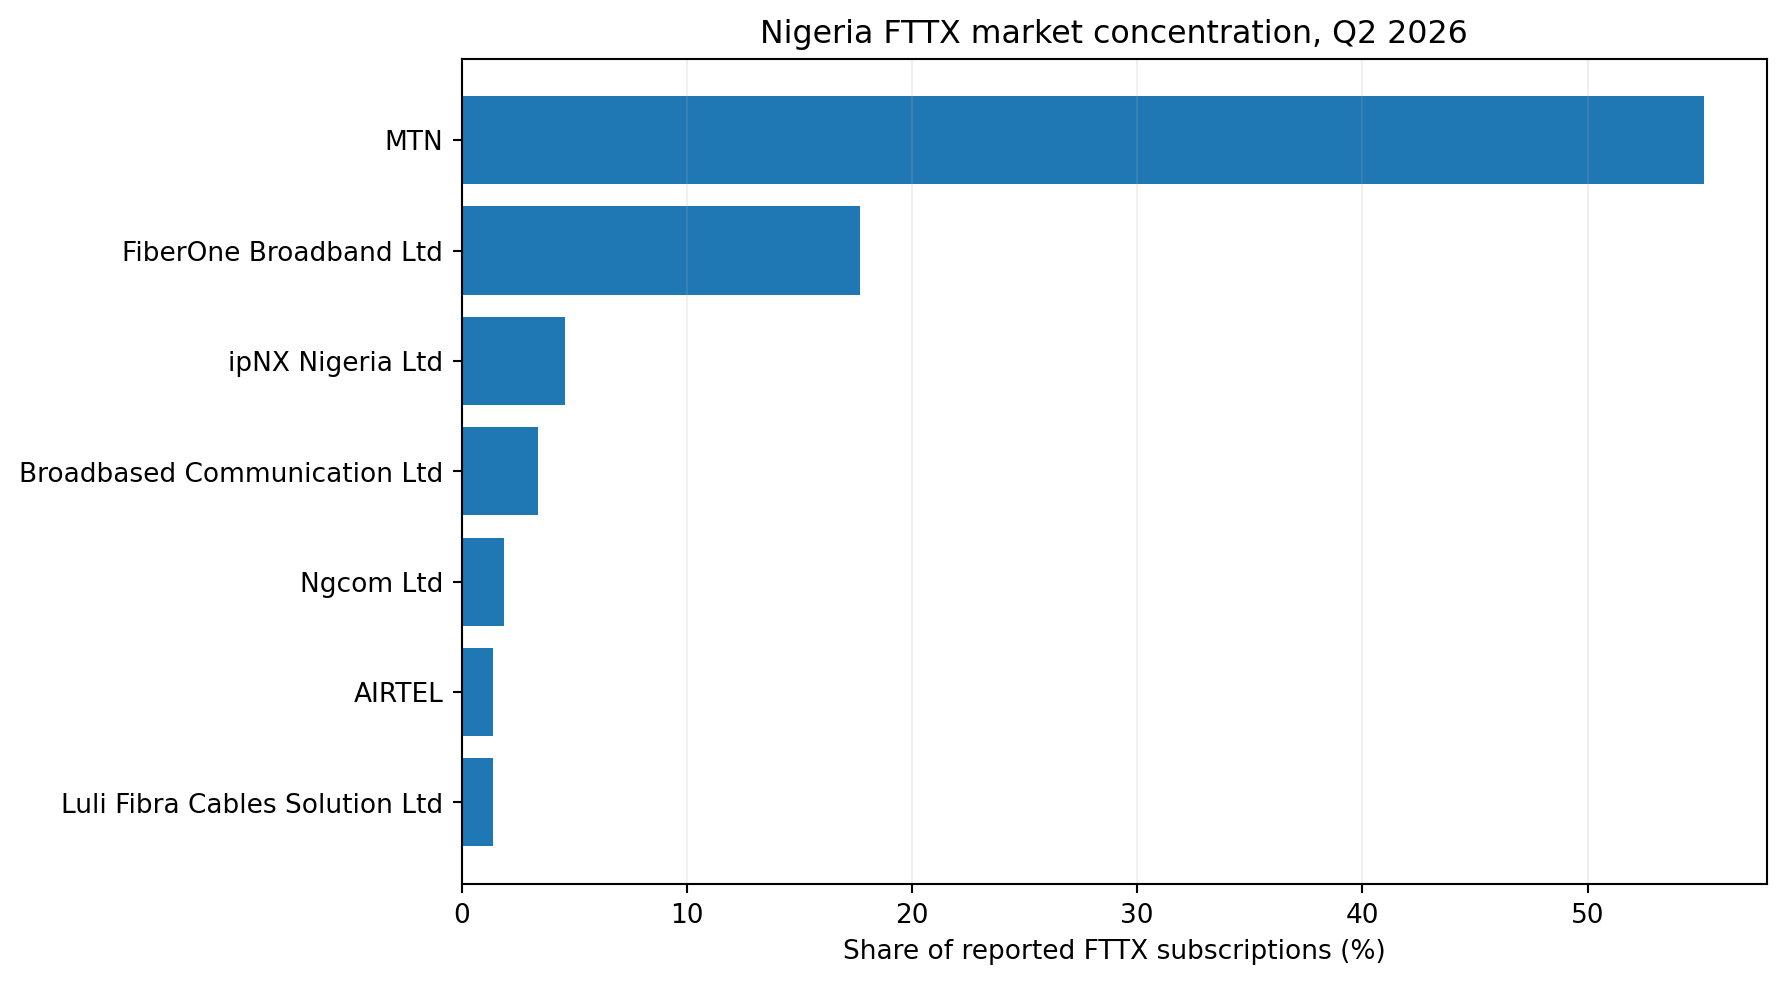
NCC Q2 2026 data show 420,989 active licensed-ISP subscribers and 319,735 FTTX subscriptions. These figures are small beside national broadband totals, so state internet demand cannot be treated as fixed-broadband demand.
Commercial implication: the investable unit is likely a dense estate, district, SME corridor or enterprise cluster, not an entire state.
MTN accounts for about 55.2% of reported FTTX subscriptions, while MTN and FiberOne together account for about 72.9%.
Commercial implication: whitespace must be demonstrated at neighbourhood or corridor level. A state can be attractive and still contain heavily contested premium clusters.
Infrastructure and provider evidence separated the shortlist into three commercial paths rather than one ranking.
Advance directly to estate, district and business-cluster validation.
Test hybrid FWA/FTTH economics, affordability and anchor demand.
Refresh infrastructure and provider evidence before capital-heavy design.
Commercial implication: “which state wins?” is the wrong final question. The evidence supports different validation paths based on market structure.
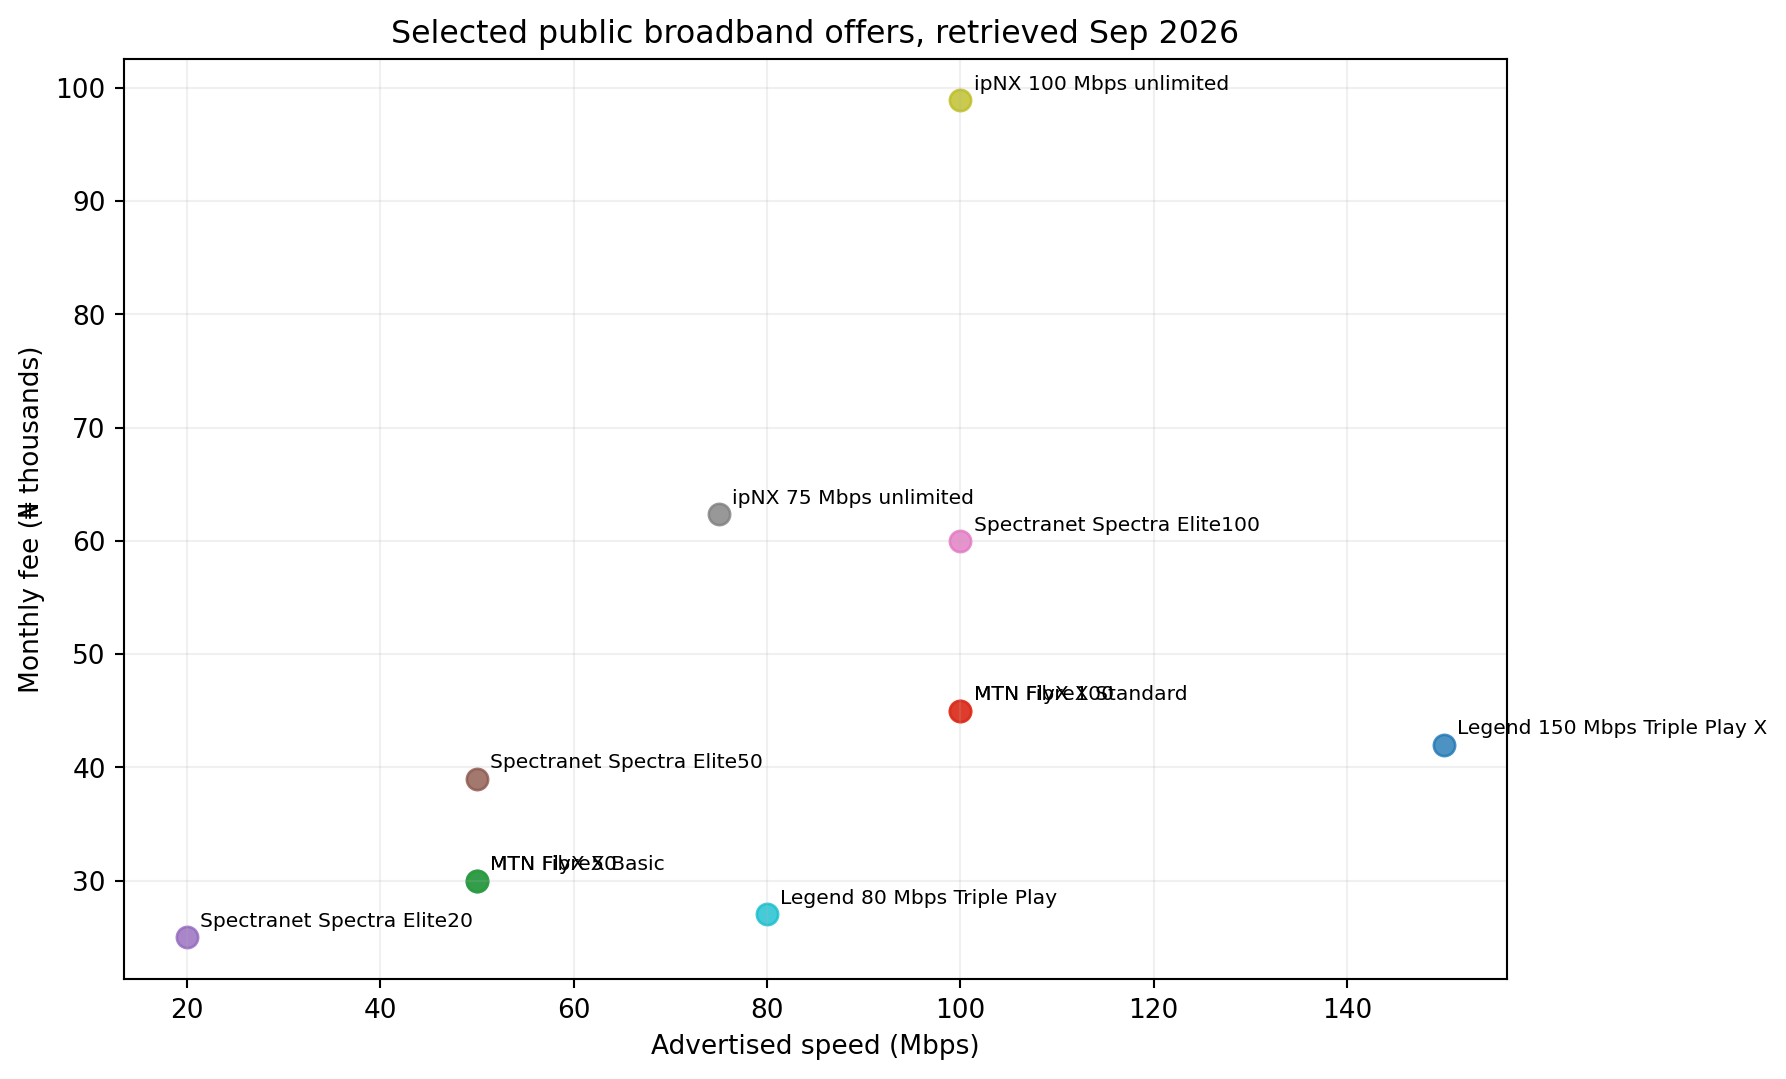
Observed public residential and fixed-broadband offers span roughly ₦12,500 to almost ₦98,900 per month across fibre and fixed-wireless products, with materially different installation terms, FUPs, bundles and location constraints.
Commercial implication: a new entrant should test reliability, installation experience, support quality and segment fit instead of assuming that more Mbps or a lower headline price is enough.
Recommendation
The evidence supports a staged 90-day decision process rather than a broad rollout.
Choose 2–3 estate, district or business clusters in Lagos, FCT, Ogun and Rivers using live coverage and customer-density evidence.
Test current spend, switching triggers, service-quality pain points and willingness-to-pay with target households, SMEs and enterprise anchors.
Compare FTTH and FWA using actual backhaul, route, CPE, installation, support and acquisition costs.
Measure take-up, activation cost, install lead time, uptime, ARPU, support demand and retention signals before scaling.
Evidence discipline
Primary evidence: National Bureau of Statistics, Nigerian Communications Commission, and public provider offer pages retrieved September 2026.
State internet subscriptions are subscriptions, not unique people. Subscription intensity can therefore exceed 100.
IGR per capita is a commercial-capacity proxy. It is not household income, affordability or willingness-to-pay.
Provider or licence presence in a city or state does not prove service availability at a specific building, estate or street.
Public tariffs differ by technology, FUP, installation terms, bundles and service quality. They are not a direct price ranking.
No local build-cost, churn, CAC, ARPU or addressable-premises figures are fabricated.
The strategy should therefore be interpreted as a validation roadmap, not an investment-grade network deployment recommendation.
Considering a market-entry or expansion decision?
ONE Light Analytics can combine market, customer, competitor, pricing and operating evidence into a structured expansion recommendation and validation path.