
Audit
Reconciled 1.07 million lines, missing customer identifiers, negative quantities, zero/negative prices and duplicate candidates.
Demonstration Study • Revenue Intelligence • Retail
A transaction-level revenue intelligence study that moves beyond headline sales to diagnose return leakage, customer concentration, repeat purchasing, product economics and geographic opportunity.
Context
The management problem was not “what is revenue?” It was “what is driving it, where is it leaking, which customers matter most, and what deserves action next?”
The study used two years of transaction-level retail data to build a reconciled commercial view across sales, returns, customers, products, baskets and countries. The analytical design deliberately preserved valid company-level revenue even when Customer ID was missing, while restricting customer-level metrics to identified customers.
Demonstration note: This is not a client engagement and the retailer is not identified. The data are historical and are used to demonstrate analytical method, decision framing and communication quality rather than to describe current retail conditions.
Executive view
Method
The workflow separated transaction semantics before analysis so that merchandise revenue was not mixed with carriage, fees, bad debt, manual adjustments, samples, tests or gift vouchers.
Reconciled 1.07 million lines, missing customer identifiers, negative quantities, zero/negative prices and duplicate candidates.
Separated merchandise sales and returns from non-merchandise adjustments and operational records.
Revenue trends, return leakage, RFM segmentation, customer concentration, cohorts, baskets, products and geography.
Converted patterns into management priorities while preserving limitations and avoiding unsupported profitability claims.
Findings
For comparable January-November periods, gross merchandise sales increased 2.9% in 2011 versus 2010. Return value increased 29.6%, leaving net sales growth at only 2.2%.
Commercial implication: growth reporting needs a leakage view. A stronger top line can hide deterioration in the quality of revenue.
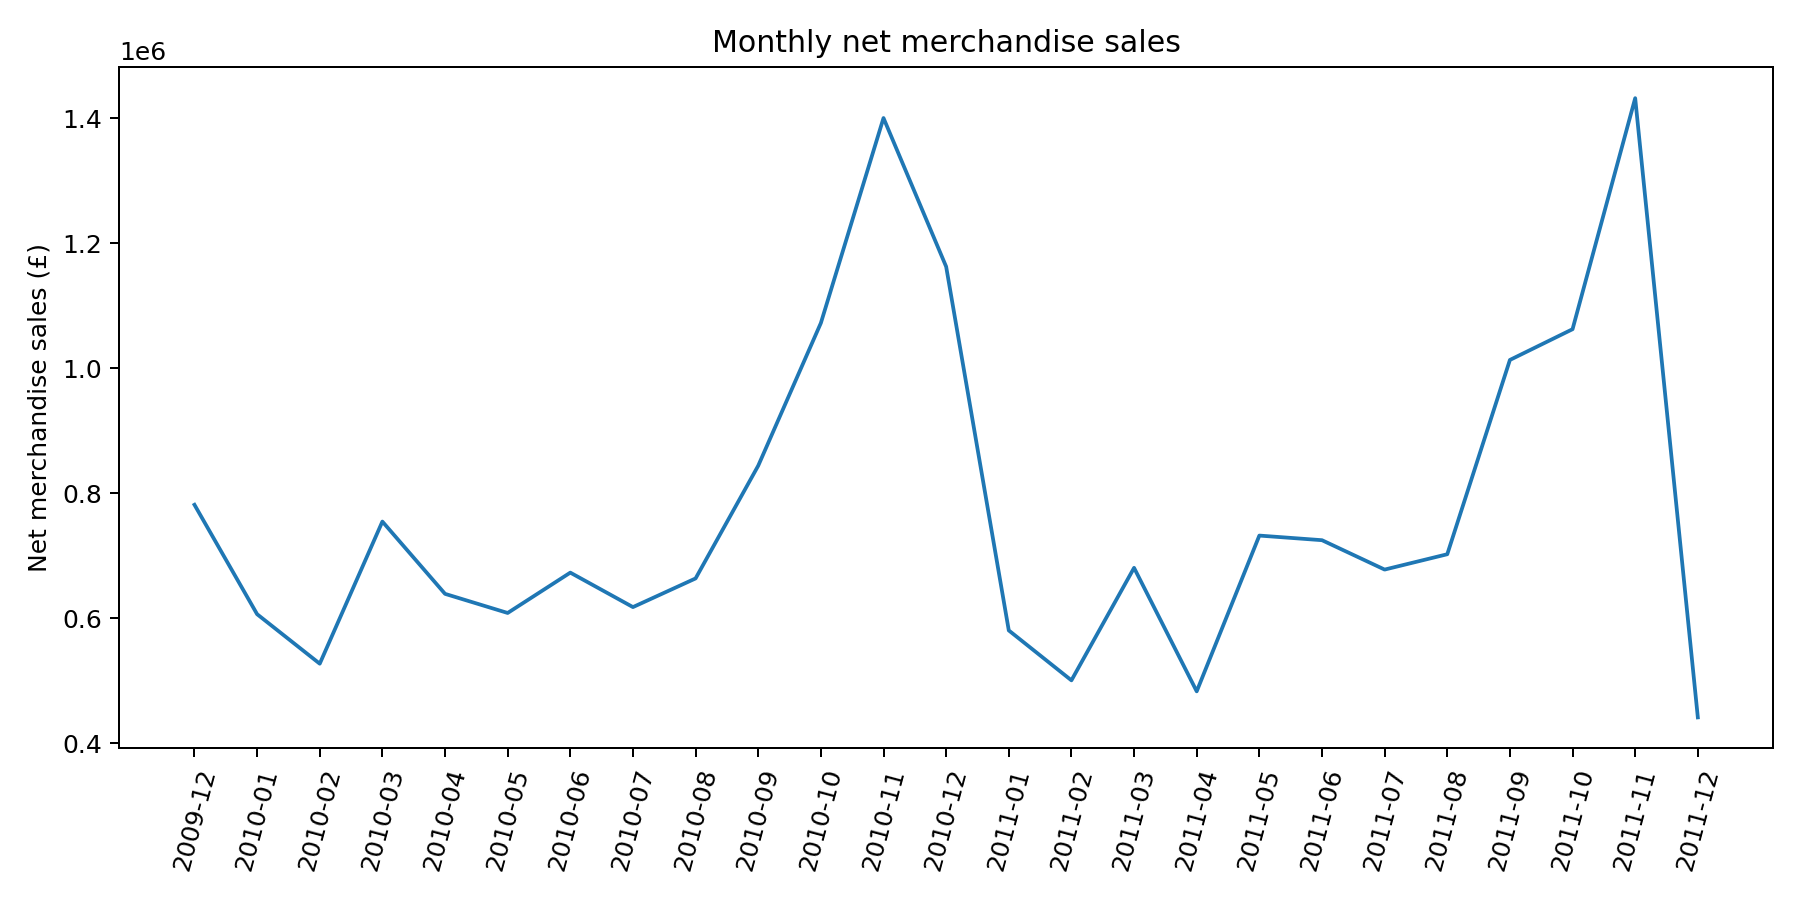
The largest single return invoice was £168,470. The two largest return invoices together accounted for 33.8% of all merchandise return value in the source period.
Commercial implication: routine return behaviour and high-value exceptions should be monitored separately so that one-off events do not obscure operational patterns.
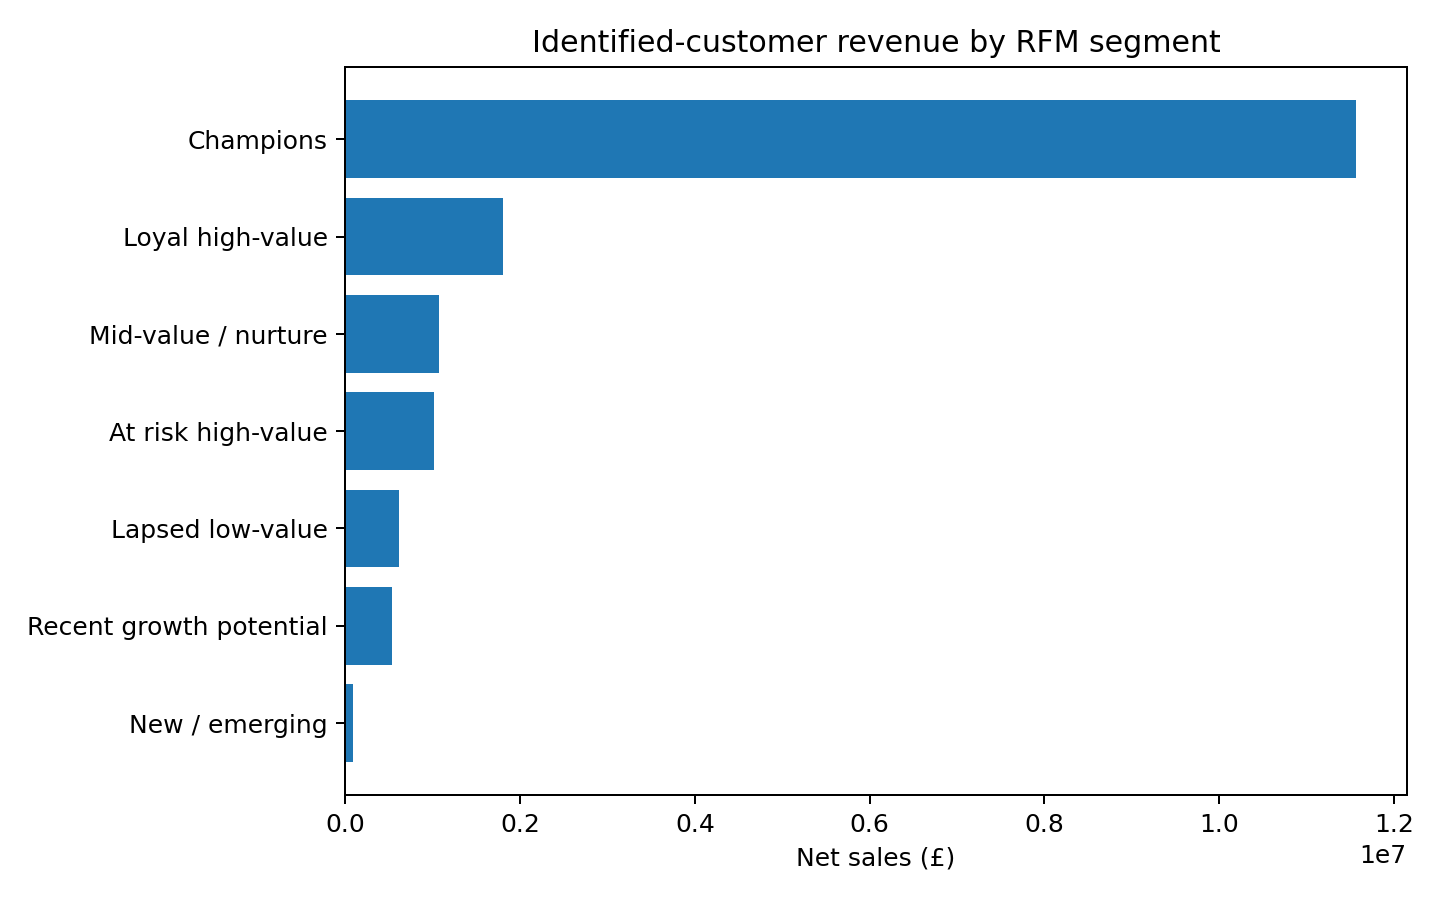
The top 1% of identified purchasing customers generated 31.2% of identified-customer net sales. The top 10% generated 63.3%, while the top 20% generated 76.8%.
Commercial implication: concentration creates both account-growth opportunity and dependency risk. High-value customer retention should be visible at executive level.
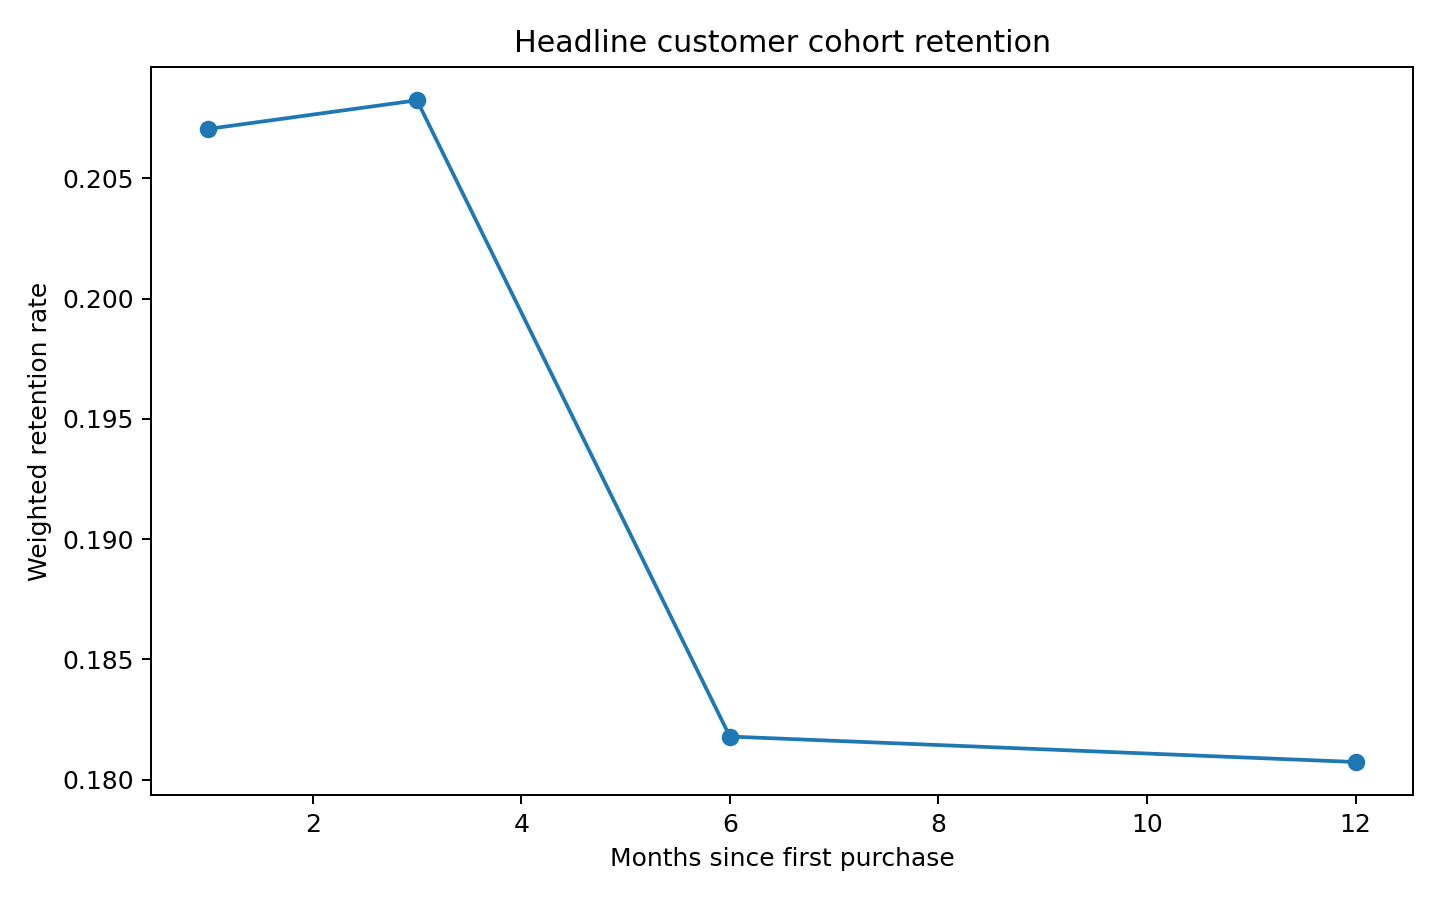
Weighted repurchase retention was 20.7% at month 1 and approximately 18.1% at month 12 across eligible cohorts. These are transaction-based repurchase measures, not subscription survival metrics.
Commercial implication: customer acquisition should be evaluated with cohort repurchase behaviour, not just new-customer counts.
About 13.8% of net merchandise sales could not be tied to an identified Customer ID. Those transactions remain valid for company-level revenue reporting but cannot contribute reliably to customer value, RFM or retention analysis.
Commercial implication: customer identification is not merely a CRM hygiene issue. It determines how much of the revenue base can be managed through retention and lifetime-value analytics.
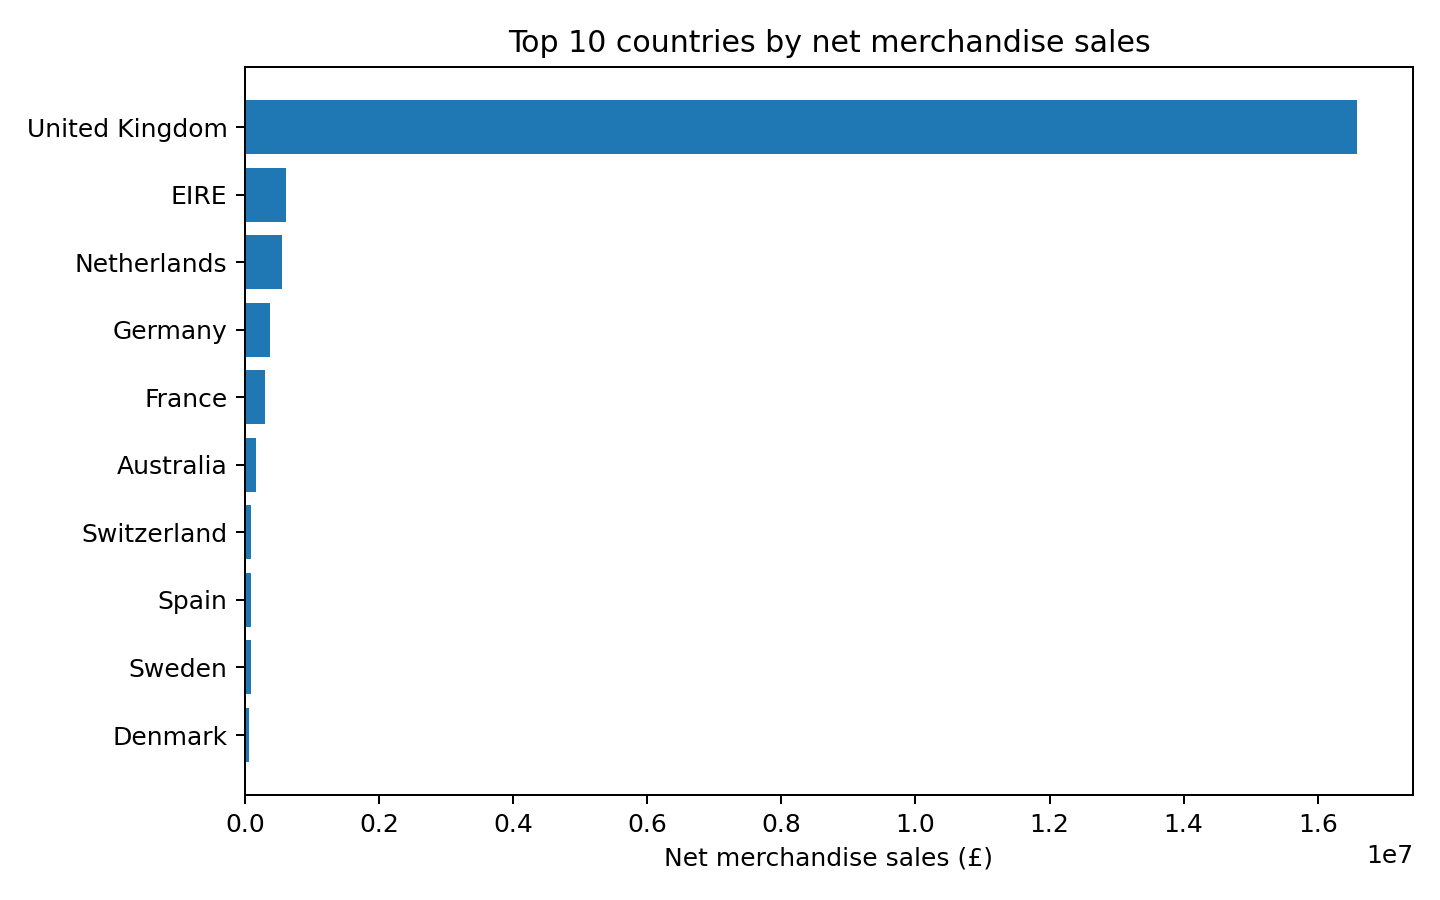
The top 100 products represented 28.9% of merchandise net sales, materially less concentrated than the customer base. The United Kingdom generated 85.6% of net merchandise sales, while several international markets showed meaningful sales with different return profiles.
Commercial implication: customer concentration, assortment optimisation and international growth should be managed as separate questions rather than treated as one generic growth problem.
Recommendation
The evidence supports a sequence of management actions rather than a single “growth” initiative.
Track concentration, recent purchase behaviour and account-level exceptions so valuable customers receive differentiated retention attention.
Introduce an exception review for unusually large return transactions while monitoring underlying return rates by customer, product and market.
Use month-based repurchase cohorts to evaluate whether newly acquired customers become repeat buyers.
Increase the share of transactions linked to a customer identifier so retention and value analytics cover more of the revenue base.
Use product-pair and country evidence to prioritise controlled tests, then add margin, inventory, acquisition cost and operational data before scaling.
Evidence discipline
No profitability claim.
Product cost and margin are not in the source.
No marketing ROI claim.
Acquisition channel and campaign cost are unavailable.
No stock-out causality.
Inventory-on-hand is not included.
No return-reason diagnosis.
The source records returns but not reasons.
No silent duplicate deletion.
Duplicate candidates change net sales by only 0.28% in sensitivity analysis and are retained in the primary model.
No current-market claim.
The source period is historical and is used to demonstrate analytical capability.
Have a similar commercial question?
ONE Light Analytics can structure the evidence across transactions, customers, products, channels and markets, then translate the result into management action.